The text read off it
[page 29]
The actual methods of storing a table for use are described in Chapter 4, since data description entries are required. To illustrate the general principles involved in preparing and using a table, however, the following example may be helpful:
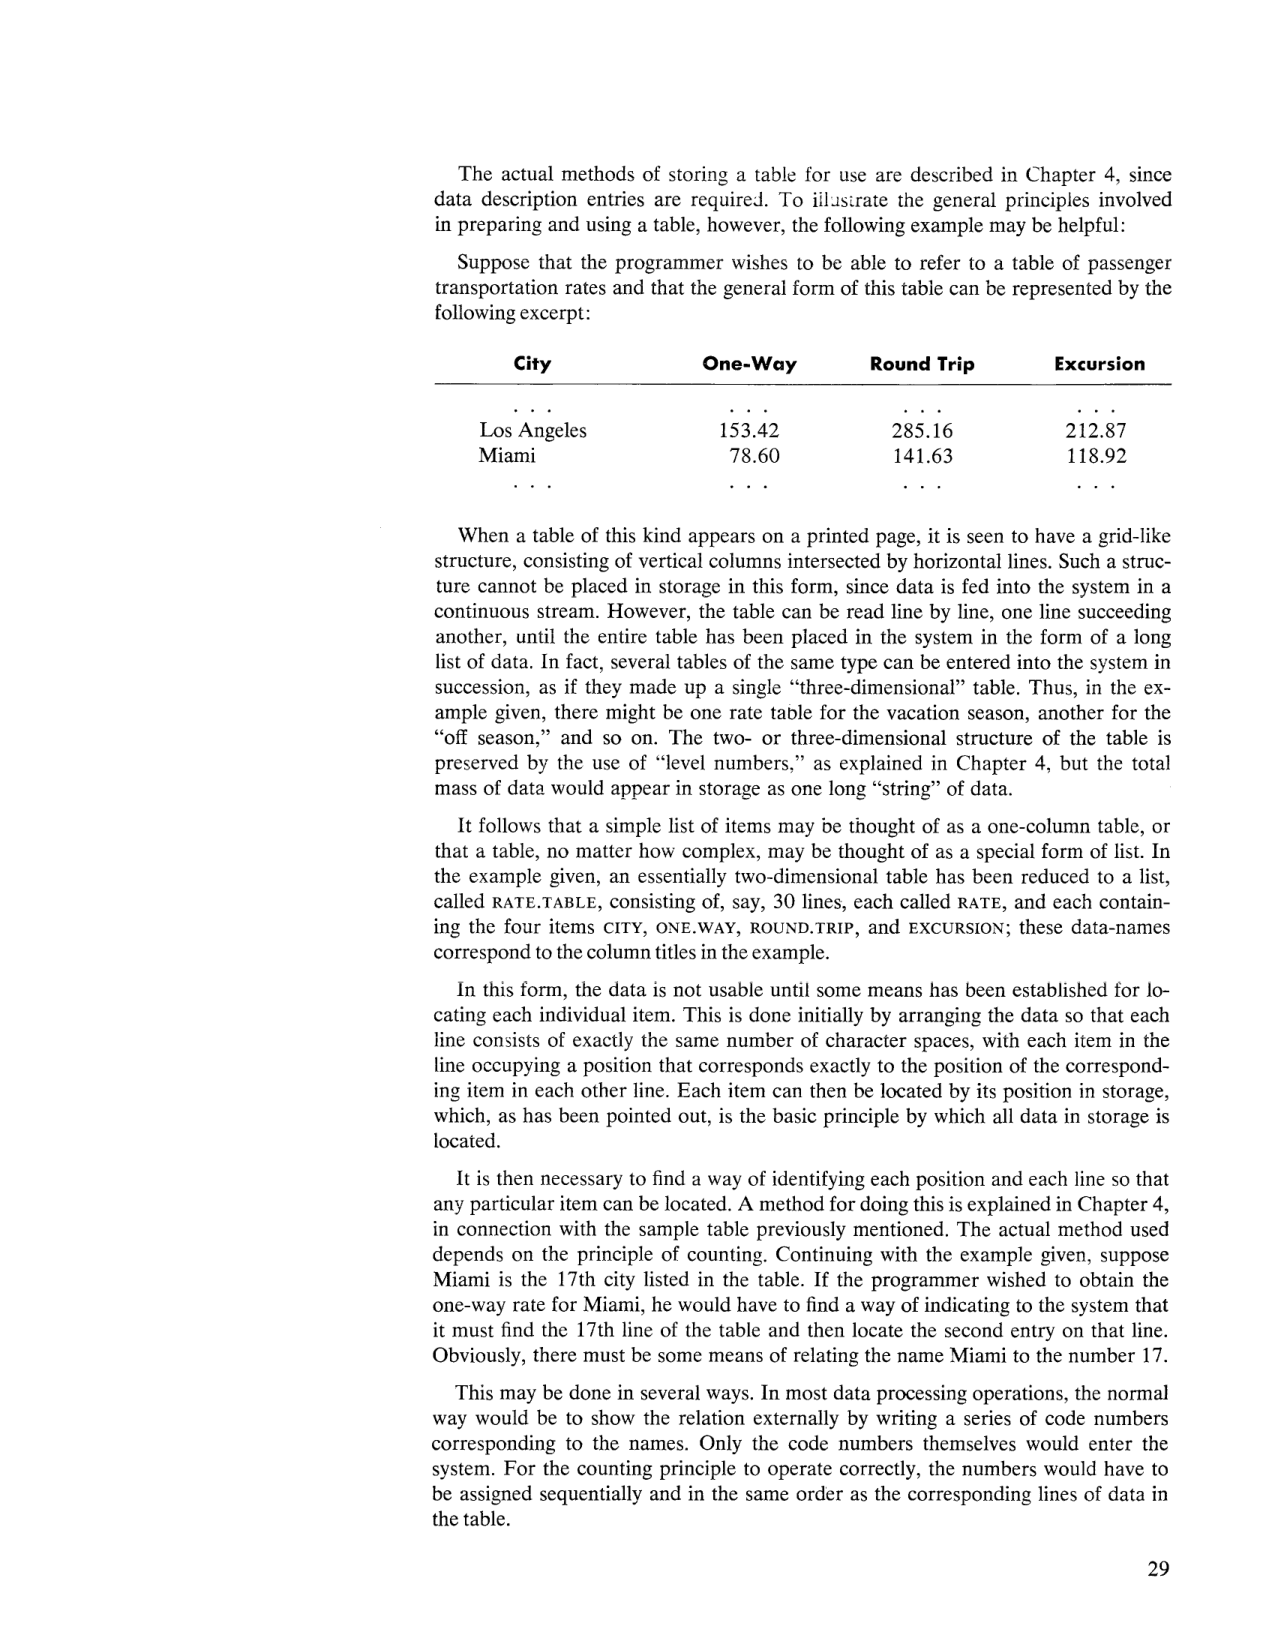
Suppose that the programmer wishes to be able to refer to a table of passenger transportation rates and that the general form of this table can be represented by the following excerpt:
| City | One-Way | Round Trip | Excursion |
|---|---|---|---|
| . . . | . . . | . . . | . . . |
| Los Angeles | 153.42 | 285.16 | 212.87 |
| Miami | 78.60 | 141.63 | 118.92 |
| . . . | . . . | . . . | . . . |
When a table of this kind appears on a printed page, it is seen to have a grid-like structure, consisting of vertical columns intersected by horizontal lines. Such a structure cannot be placed in storage in this form, since data is fed into the system in a continuous stream. However, the table can be read line by line, one line succeeding another, until the entire table has been placed in the system in the form of a long list of data. In fact, several tables of the same type can be entered into the system in succession, as if they made up a single “three-dimensional” table. Thus, in the example given, there might be one rate table for the vacation season, another for the “off season,” and so on. The two- or three-dimensional structure of the table is preserved by the use of “level numbers,” as explained in Chapter 4, but the total mass of data would appear in storage as one long “string” of data.
It follows that a simple list of items may be thought of as a one-column table, or that a table, no matter how complex, may be thought of as a special form of list. In the example given, an essentially two-dimensional table has been reduced to a list, called RATE.TABLE, consisting of, say, 30 lines, each called RATE, and each containing the four items CITY, ONE.WAY, ROUND.TRIP, and EXCURSION; these data-names correspond to the column titles in the example.
In this form, the data is not usable until some means has been established for locating each individual item. This is done initially by arranging the data so that each line consists of exactly the same number of character spaces, with each item in the line occupying a position that corresponds exactly to the position of the corresponding item in each other line. Each item can then be located by its position in storage, which, as has been pointed out, is the basic principle by which all data in storage is located.
It is then necessary to find a way of identifying each position and each line so that any particular item can be located. A method for doing this is explained in Chapter 4, in connection with the sample table previously mentioned. The actual method used depends on the principle of counting. Continuing with the example given, suppose Miami is the 17th city listed in the table. If the programmer wished to obtain the one-way rate for Miami, he would have to find a way of indicating to the system that it must find the 17th line of the table and then locate the second entry on that line. Obviously, there must be some means of relating the name Miami to the number 17.
This may be done in several ways. In most data processing operations, the normal way would be to show the relation externally by writing a series of code numbers corresponding to the names. Only the code numbers themselves would enter the system. For the counting principle to operate correctly, the numbers would have to be assigned sequentially and in the same order as the corresponding lines of data in the table.